Introduction to Data Exploration – Feature Engineering and Feature Selection in Data Mining
In this article, I will discuss,
- How to read the dataset?
- How to know the data types of columns?
- general Data Description
- Univariate analysis and Bi-Variate Analysis
Video Tutorial – Data Exploration in Data Mining
Click here to download the titanic.csv file, the dataset used in this demonstration.
First, we will import the required libraries like pandas, numpy, seaborn, matplotlib, and explore from data_exploration.
import pandas as pd
import numpy as np
import seaborn as sns
import matplotlib.pyplot as plt
import os
plt.style.use('seaborn-colorblind')
%matplotlib inline
from data_exploration import explore
Next, we use the read_csv() function from the pandas library to read the dataset. We are interested in few columns hence a list with use_cols is created with required columns.
use_cols = ['Pclass', 'Sex', 'Age', 'Fare', 'SibSp', 'Survived']

data = pd.read_csv('./data/titanic.csv', usecols=use_cols)
Now we display the first five rows, to confirm whether the dataset is read successfully or not using the data.head(5) function.
| Survived | Pclass | Sex | AgeAge | SibSp | Fare | |
| O | O | 3 | male | 22.0 | 1 | 7.2500 |
|---|---|---|---|---|---|---|
| 1 | 1 | 1 | female | 38.0 | 1 | 71.2833 |
| 2 | 1 | 3 | female | 26.0 | O | 7.9250 |
| 3 | 1 | 1 | female | 35.0 | 1 | 53.1000 |
| 4 | O | 3 | male | 35.0 | O | 8.0500 |
Univariate Analysis
Below are some methods that can give us the basic stats on the variable:
- pandas.Dataframe.dtypes
- pandas.Dataframe.describe()
- Barplot
- Countplot
- Boxplot
- Distplot
pandas.Dataframe.dtypes
Now we use the get_dtypes() function to get the types of each column and display them.
str_var_list, num_var_list, all_var_list = explore.get_dtypes(data=data)
print(str_var_list) # string type
print(num_var_list) # numeric type
print(all_var_list) # all
Output:
[‘Sex’]
[‘Survived’, ‘Pclass’, ‘Age’, ‘SibSp’, ‘Fare’]
[‘Sex’, ‘Survived’, ‘Pclass’, ‘Age’, ‘SibSp’, ‘Fare’]
pandas.Dataframe.describe()
Next, we use the describe() function to get the general description of dataset. The describe() function displays different statistics like, count, unique values, frequency, mean, standard deviation, minimum, maximum, 25%, 50% and 75% percentile.
explore.describe(data=data,output_path=r'./output/')
Out of describe() function():
| Survived | Pclass | Sex | Age | SibSp | Fare | |
| count | 891.000000 | 891.000000 | 891 | 714.000000 | 891.000000 | 891.000000 |
|---|---|---|---|---|---|---|
| unique | NaN | NaN | 2 | NaN | NaN | NaN |
| top | NaN | NaN | male | NaN | NaN | NaN |
| freq | NaN | NaN | 577 | NaN | NaN | NaN |
| mean | 0.383838 | 2.308642 | NaN | 29.699118 | 0.523008 | 32.204208 |
| std | 0.486592 | 0.836071 | NaN | 14.526497 | 1.102743 | 49.693429 |
| min | 0.000000 | 1.000000 | NaN | 0.420000 | 0.000000 | 0.000000 |
| 25% | 0.000000 | 2.000000 | NaN | 20.125000 | 0.000000 | 7.910400 |
| 50% | 0.000000 | 3.000000 | NaN | 28.000000 | 0.000000 | 14.454200 |
| 75% | 1.000000 | 3.000000 | NaN | 38.000000 | 1.000000 | 31.000000 |
| max | 1.000000 | 3.000000 | NaN | 80.000000 | 8.000000 | 512.329200 |
Discrete variable barplot
discrete_var_barplot() function is used to draw the barplot of a discrete variable x against y (that is target variable). By default, the bar shows the mean value of y.
explore.discrete_var_barplot(x='Pclass',y='Survived',data=data,output_path='./output/')

Discrete variable countplot
discrete_var_countplot() function is used to draw the countplot of a discrete variable x.
explore.discrete_var_countplot(x='Pclass',data=data,output_path='./output/')

Discrete variable boxplot
discrete_var_boxplot() function is used to draw the boxplot of a discrete variable x against y.
explore.discrete_var_boxplot(x='Pclass',y='Fare',data=data,output_path='./output/')

Bi-variate Analysis
Bi-variate Analysis is performed to understand the descriptive statistics between two or more variables.
- Scatter Plot
- Correlation Plot
- Heat Map
Continuous variable distplot
continuous_var_distplot() issued to draw the distplot of a continuous variable x.
explore.continuous_var_distplot(x=data['Fare'],output_path='./output/')

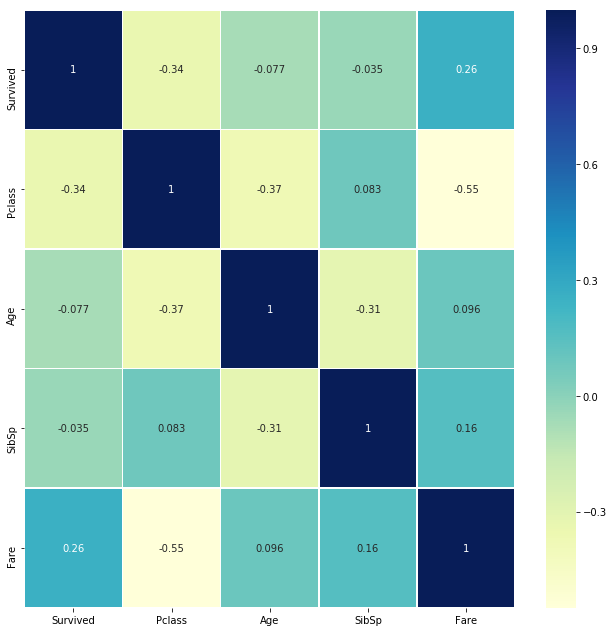
Correlation plot
correlation_plot() function I used to draw the correlation plot between variables.
explore.correlation_plot(data=data,output_path='./output/')
Summary
This article introduces the Data Exploration – FeatureEngineering and Feature Selection in Data Mining. If you like the material share it with your friends. Like the Facebook page for regular updates and YouTube channel for video tutorials.